Awhile back, I came across a video from one of my favorite channels, Numberphile, on Conway’s Game of Life. Turns out, it’s not a game you can actually “play,” beyond setting the initial state of a simulation that progresses via a set of very simple rules. Devised by the British mathematician John Conway in 1970, the game is composed of a grid of cells, each of which can be alive or dead. Each cell’s state in the next generation depends on that of its neighbors, according to the following set of rules:
- Any live cell with fewer than two live neighbours dies, as if by underpopulation.
- Any live cell with two or three live neighbours lives on to the next generation.
- Any live cell with more than three live neighbours dies, as if by overpopulation.
- Any dead cell with exactly three live neighbours becomes a live cell, as if by reproduction.
Let’s implement this in numpy and scipy, the foundational packages in Python’s scientific computing ecosystem.
Creating a random grid with numpy
A grid of cells that can be alive (1) or dead (0) is just a matrix of binary values. Using numpy’s utilities for generating random arrays, we can create an example grid of random ones and zeroes like this:
>>> import numpy as np

>>> def create_random_grid(length: int = 4, width: int = 4, seed = None) -> np.array:
... """Create a random 2D binary array sampled from a uniform distribution."""
... rng = default_rng(seed = seed)
... return rng.integers(
...    low = 0, high = 2, size = length * width
... ).reshape(length, width)

>>> grid = create_random_grid()
>>> print(grid)
array([[0, 0, 1, 1],
       [1, 1, 0, 1],
       [1, 1, 1, 1],
       [1, 0, 1, 1]])
In this code block, we use numpy’s default random number generator (RNG) to create an array of 16 integers in the range [0, 2) (the upper bound is excluded), which we then reshape into a 4x4 matrix. This will represent the initial conditions of Conway’s game.
Counting neighbors with scipy’s ndimage library
Next, we need a way to check the number of living neighbors of each cell. In an infinite grid, every cell has 8 neighbors: 3 above, 3 below, and one on either side. Including the central cell, that’s a 3x3 window that we’ll need to construct for every cell in the grid, counting the live cells each time. We can then set the new value of the central cell based on the sum of its neighbors. If this sounds familiar, it might be because this is the same kind of procedure you would see in a layer of a convolutional neural network, where a kernel is applied over a sliding window of an image or signal. We don’t need to install pytorch for our game though!
Instead, we’ll use the convolve function in scipy.ndimage 1. Provided our initial grid and a kernel, convolve will perform an element-wise multiplication of the elements in the window and the kernel and then sum the result for every cell in the grid. For the mathematically inclined, the docs describe it thus,
[Each element in the convolved array is] $C_i = \sum_{j} I_{i+k-j}W_j$ where W is the weights kernel, j is the N-D spatial index over W, I is the input and k is the coordinate of the center of W, specified by origin in the input parameters.
Since our grid is a binary matrix, convolving it with a 3x3 kernel of all ones will count the number of live cells in the window. If we change the central value of the kernel to a zero, we’ll exclude the central cell and just count the neighbors.
>>> from scipy import ndimage
>>> def count_neighbors(grid: np.array) -> np.array:
...     """Count the live neighbors of each cell in a 2D binary array,
        treating off-grid neighbors as dead. Returns an np.array of
        the same size as the input."""
...     kernel = np.array([1,1,1,1,0,1,1,1,1]).reshape(3,3)
...     return ndimage.convolve(grid, kernel, mode = 'constant', cval = 0.0)

>>> neighbors = count_neighbors(grid)
>>> print(neighbors)
array([[2, 3, 3, 2],
       [3, 5, 7, 4],
       [4, 6, 6, 4],
       [2, 5, 4, 3]])
Here, setting the mode to constant with a cval of 0.0 instructs convolve to treat any off-grid neighbors (from cells on the edges) as 0.0 by padding the outside of the grid2.
Now, for the rules.
Applying the rules
Rather than jump in and implement each of the 4 rules above, let’s consider the possible cases where a cell could be alive in the next generation.
- According to rule (2), a cell that is alive and has 2 neighbors will stay alive.
- Based on rules (2) and (4), any cell, alive or dead, with 3 neighbors will be alive.
- Factoring in rules (1) and (3), we know every other cell will die or remain dead.
Taking advantage of numpy’s built-in, vectorized methods for element-wise comparisons, we can use boolean logic to implement these rules:
>>> def apply_conways_rules(grid: np.array) -> np.array:
...     """Provided a 2D array of neighbor counts, return
        the next generation of living cells."""
...   neighbors = count_neighbors(grid)
...   return ((neighbors == 2) & grid) | (neighbors == 3)

>>> apply_conways_rules(grid)
array([[0, 1, 1, 1],
       [1, 0, 0, 0],
       [0, 0, 0, 0],
       [1, 0, 0, 1]])
As in plain Python, 1 is “truthy” and 0 is “falsy” so we can smoothly convert between them. The & operator is equivalent to a logical and operation, and the | operator performs a logical or3. So, in effect, we check for each cell whether it has 2 neighbors and is alive or if it has exactly 3 neighbors. The logical operators return integers rather than booleans, so we get back our new grid in one line!
Creating an infinite simulator
Now, we just need a little scaffolding to repeatedly yield the next generation of the simulation.
>>> from typing import Generator
>>> def simulate(grid: np.array) -> Generator[np.array, None, None]:
... """Yield infinite generations of Conway's game
       provided a starting grid."""
...
... while True:
...     grid = apply_conways_rules(grid)
...     yield grid
Provided an initial grid, simulate will return a generator, which will lazily compute the next generation(s) when we ask for it. For example, we can use the islice function from the itertools package to return the state of the simulation after 5 rounds.
>>> import itertools as it
>>> generator = simulate(grid)
>>> next(it.islice(generator, 5, None))
array([[0, 0, 1, 1],
       [0, 1, 0, 1],
       [1, 1, 0, 1],
       [0, 0, 1, 1]])
Visualizing with matplotlib
Lastly, let’s create a visualization of the evolving grid. We’ll need two dependencies for this: matplotlib and ffmpeg4. matplotlib provides an animation module, which we can use to create animations that we’ll save to a gif with ffmpeg5. We’ll use matplotlib.animation.FuncAnimation to create our gif6.
The process is as follows:
- Use
isliceto collect a list of matrices representing consecutive generations of the simulation - Create a
matplotlib.pyplotfigure withplt.matshowof the initial grid - Define
initandupdatefunctions which will repeatedly update the data in the plot to create the animation - Create the animation with
matplotlib.animation.FuncAnimation - Save the animation as a gif with
matplotlib.animation.FFMpegWriter
>>> def save_conway_to_gif(grid: np.array, filepath: PathLike, nframes: int = 100) -> None:
...    """
       Create a gif of the first nframes of
       evolution of the provided grid and save it to filepath.
       """

...    # create a list of arrays representing the first NFRAMES generations
...    data = list(it.islice(simulate(grid), 0, nframes))

...    # create an initial matrix figure without ticks or labels
...    fig = plt.figure()
...    plot = plt.matshow(data[0], fignum=0, cmap = plt.get_cmap('binary'))
...    plt.tick_params(left = False, right = False , labelleft = False,
...                    labelbottom = False, bottom = False, top = False,
...                    labeltop = False)
...    def init():
...        """
           Provides the initial plot
           (to be passed to FuncAnimation's init_func arg as a callable)
           """
...        plot.set_data(data[0])
...        return [plot]

...    def update(j):
...        """
           Updates the figure's data in place
           (to be passed to the FunAnimation func arg as a callable).
           """
...        plot.set_data(data[j])
...        return [plot]

...    metadata = dict(
...       title="Conway's Game of Life", artist='Will', comment=''
... )
...    writer = animation.FFMpegWriter(fps=5, metadata=metadata, bitrate=3500)
...    anim = animation.FuncAnimation(
...        fig, update, init_func = init,
...        frames=nframes, interval = 30, blit=True
...    )
...    anim.save(filepath, writer = writer, dpi = 300)
If we use the create_random_grid function to select a random initial state of the simulation (where each cell has equal probability to be alive or dead), we might see something like this:
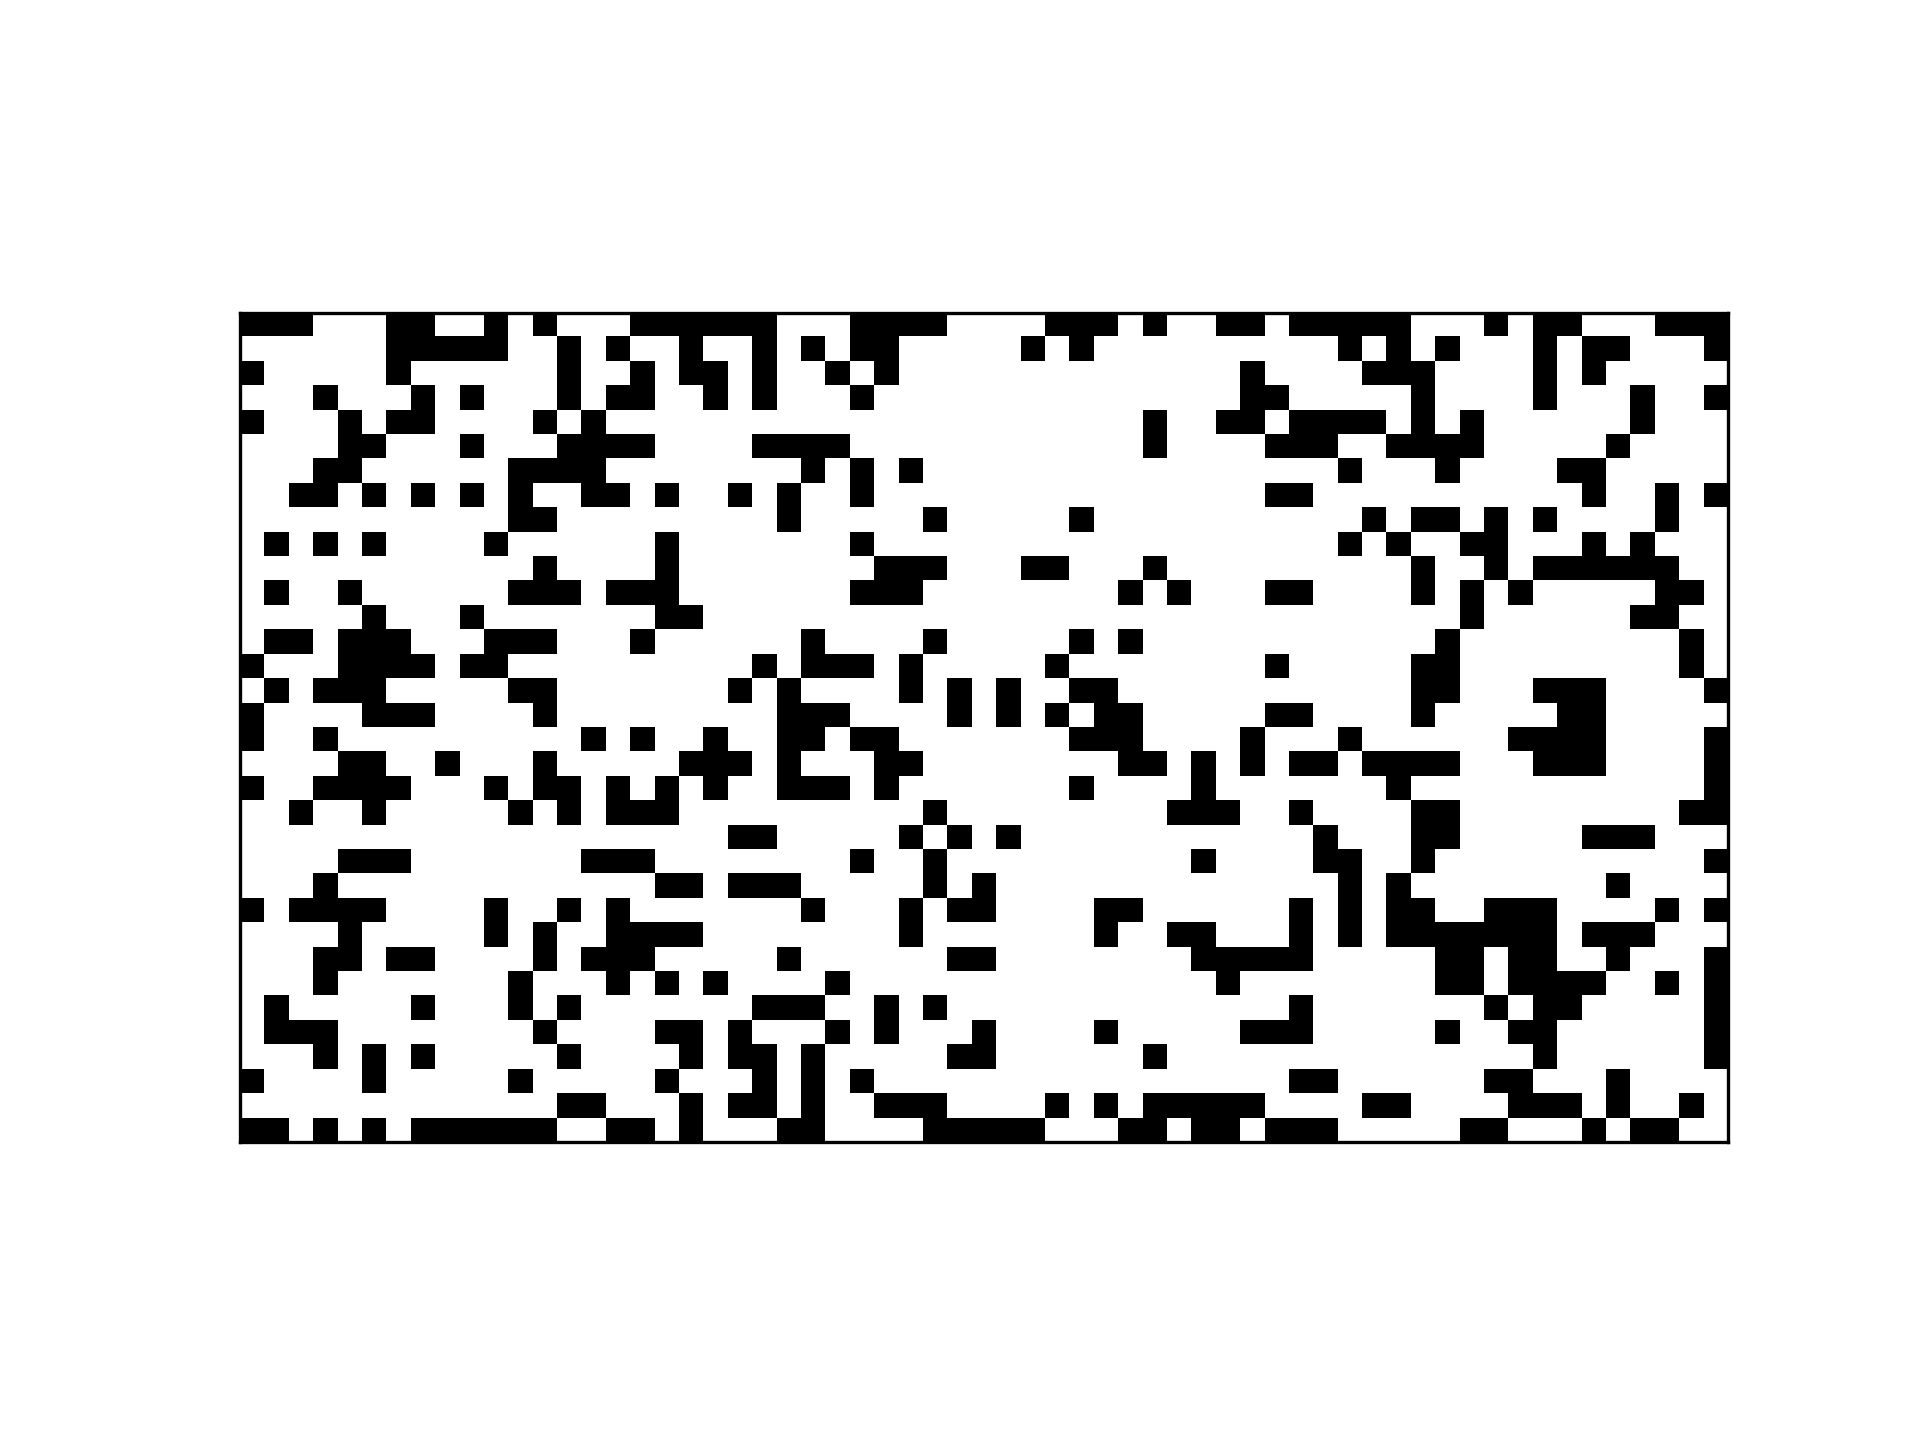
Already some interesting, periodic patterns!
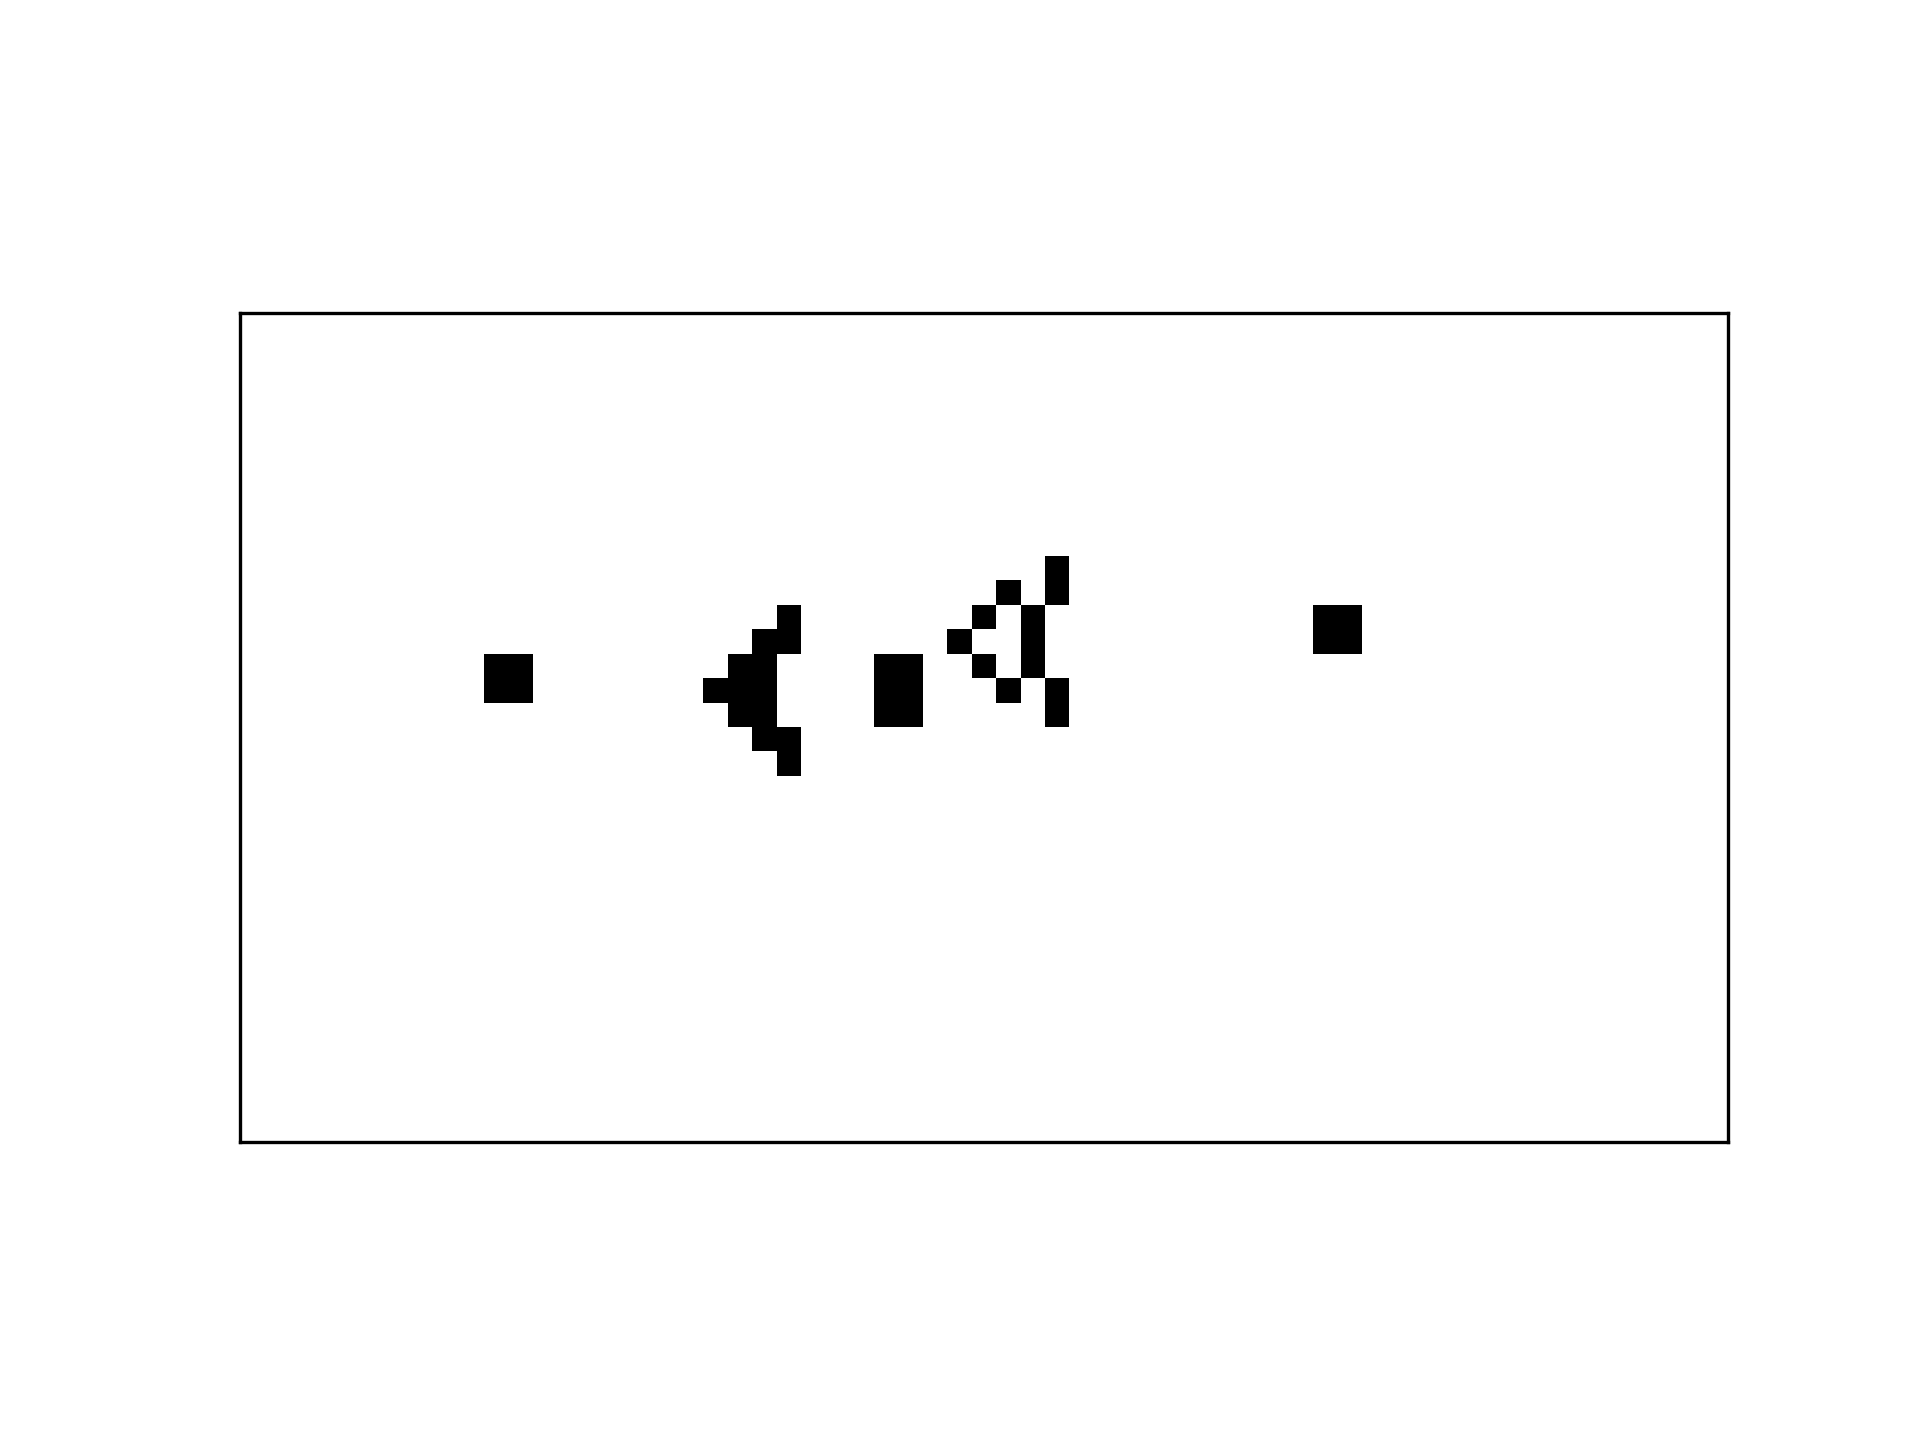
Lastly, I took a moment to get the plaintext code for a cool, repeating pattern, the Gosper glider gun. This pattern repeatedly emits new ‘spaceships’ and cycles back to its initial state every 30 generations.
I’m barely scratching the surface of the interesting patterns that have been discovered. If you’re interested in going down the rabbit hole, I’d recommend conwaylife.com (the homepage of the wiki is quite a trip!).
You can find the complete source for this post here.
For a purely
numpybased implementation, we can use thesliding_window_viewfunction innumpy’sstride_tricksmodule. First pad the grid with zeroes usingnp.pad, apply a 3x3 window withsliding_window_view, sum across the 2nd and 3rd axes, and subtract the original grid to exclude the central cell from each count. ↩︎For image processing, we’d probably want to extend out the color at the ends (as though the same pixel color continued outside the edge of the image). The default value for the
modeparameter, reflect, does exactly that. ↩︎If functions are needed rather than infix operators, numpy provides
logical_andandlogical_or(as well aslogical_notandlogical_xor). ↩︎ffmpegthe python package is a wrapper aroundffmpegthe command line tool, which requires a separate installation. I installed it on my Mac with homebrew:brew install ffmpeg. ↩︎The
matplotlib.animationlibrary also supportsimagemagickandpillow. ↩︎Using the
FuncAnimationclass can be a bit unwieldy, since theinit_funcandfuncmust keep references to an external plot and update the data in place. Also tricky is that the class expects a sequence of plots (or artists, as the docs refers to them) at each iteration, not the updated plot as you might expect. ↩︎